
To check a competitor's Shopify store traffic, look up its domain in a traffic estimation tool, record the metric and reporting month, and compare several completed months from the same source. Then check its top countries and recent advertising to understand whether the store is relevant to your market.
For your own store, use the analytics you are authorized to access. A competitor's public traffic estimate is a different kind of evidence: it can help you prioritize research, but it does not reveal their orders, conversion rate, or revenue.
Choose the number that answers your question
“Traffic” can mean total visits, unique visitors, or estimated visits from organic search. Those numbers answer different questions.
| Research question | Useful evidence | What it cannot establish |
|---|---|---|
| How busy is this store? | Estimated total visits for a stated month | Exact visitor count or sales |
| Is it growing? | Comparable completed months from one provider | Why the change happened |
| Does it reach my market? | Country distribution for the same period | Buyer location or purchase intent |
| How visible is it in search? | Organic search estimates and ranking pages | Traffic from every channel |
| What is it promoting? | Public ads and their landing pages | Campaign profitability |
| How much does it sell? | Authorized transaction and financial records | This is not answered by traffic alone |
In Similarweb's terminology, total visits measure visits rather than unique people. One person can make several visits. Semrush also explains that its traffic tools use different methods and data: an organic search estimate should not be treated as the store's total traffic.
Write the metric name beside every number. This small habit prevents a large share of misleading comparisons.
How to check a Shopify store's traffic in five steps
1. Confirm the store domain
Start with the public storefront customers actually use. Check that the logo, products, currency, and contact information belong to the business you are researching.
A brand may use separate country domains, a main marketing website, and a different checkout or storefront domain. Record what the report covers. A figure for one regional domain is not automatically a figure for the whole business.
If an ad sends visitors to a campaign page, follow the destination and check whether it belongs to the same store. This also helps prevent research on an unrelated advertiser with a similar name.
2. Record the source, scope, and month
Save the domain, provider, metric, reporting period, geographic scope, and device scope where the tool exposes them. Include the date you checked the report.
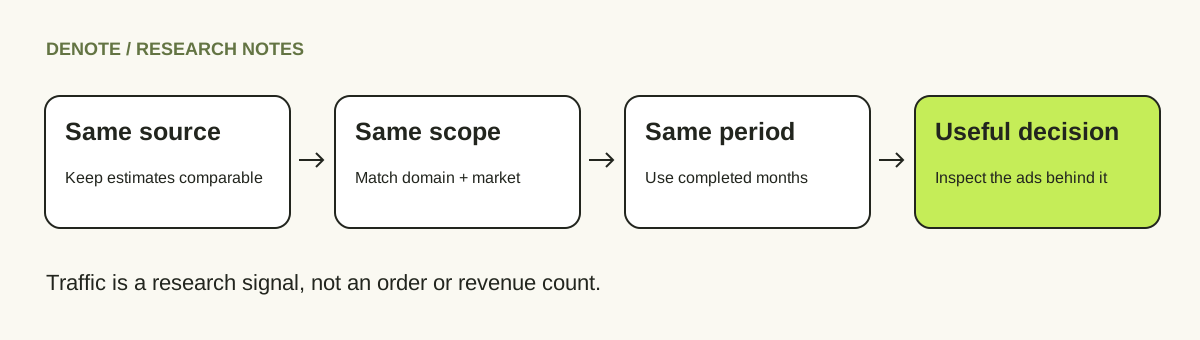
Compare the same metric from the same provider over time. Two providers can estimate different totals for the same store because they use different inputs and models. Averaging them does not create an exact count.
If you change providers, keep the two series separate. If one report says organic traffic and another says total visits, label both and use each for its own purpose.
3. Read several completed months
A single month can reflect a sale, seasonal demand, a product launch, or a temporary acquisition push. Use a longer series to see whether the change is sustained. Six months can provide useful context when that history is available; a year is more useful for comparing seasonal businesses.
Calculate month-over-month change only when both values cover comparable completed months:
Growth (%) = (current month − previous month) / previous month × 100
For example, a fictional store moving from 40,000 to 50,000 estimated monthly visits has a 25% increase in that provider's estimate. The calculation is precise; the underlying visits remain estimates. If the previous value is zero or missing, do not report a normal percentage increase.
Avoid comparing a partial current month with a full previous month. If the interface does not disclose the period clearly, record that limitation before using the number in a decision.
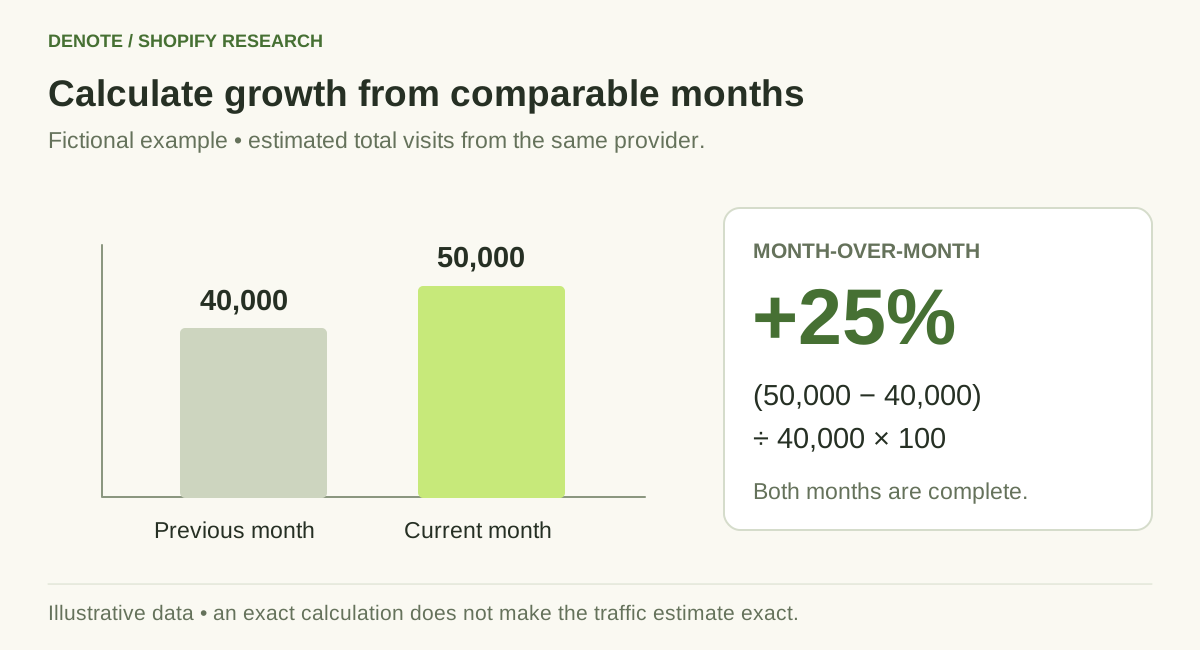
Fictional data: compare completed months from the same source; the underlying traffic figures remain estimates.
4. Check whether the audience fits
A large store can be a weak competitor reference if most of its traffic comes from markets you do not serve. Look at the country mix alongside product category, price range, shipping promises, and language.
Here is an illustrative comparison, not measured store data:
| Field | Store A | Store B |
|---|---|---|
| Previous month's estimated visits | 40,000 | 200,000 |
| Latest completed month's estimated visits | 50,000 | 190,000 |
| Change | +25% | −5% |
| Estimated share from your target country | 60% | 10% |
| Product and price fit | Close to your offer | Different price tier |
Store A is the more relevant research starting point in this example. That does not make it more profitable. Store B may still offer useful creative ideas, but its larger total alone should not decide your shortlist.
5. Connect the traffic pattern to products and ads
In Denote, use the Shopify store overview to review available monthly traffic history and top countries alongside the store's ad context. Keep the source and reporting period with the estimate. History depends on available coverage; an incomplete series should stay incomplete.
Next, inspect the ads associated with the brand and the pages they promote. When a store's estimated traffic rises, ask whether you can also observe a new product focus, a recurring offer, or a change in creative messaging. These are possible explanations to investigate, not proof that a particular ad caused the increase.
Use Track Brand to return to the brand's advertising over time. For a broader research framework, follow the Shopify competitor analysis guide.
What if the checker has no data?
An unavailable estimate does not mean the store has no visitors. Similarweb explains that “Not enough data” can reflect insufficient information to estimate a site reliably.
For a small or newly observed store, leave the traffic field blank and continue with public evidence:
- Review its product pages and positioning.
- Record the ads you can actually find and their destinations.
- Revisit the storefront to document visible changes.
- Add another comparable store with better coverage to your shortlist.
Do not fill the gap with a guessed traffic number. A clear “not available” is more useful than a figure that appears measured but is not.
Why visits do not reveal Shopify revenue
It is tempting to multiply estimated visits by an assumed conversion rate and average order value. That produces a scenario based on assumptions, not an observation of a competitor's revenue. It also combines metrics that may not use compatible definitions.
Discounts, returns, repeat purchases, acquisition costs, and product margins can change the business outcome even when traffic looks similar. Use estimates to choose what to investigate. Use your own measured results to decide what to scale.
When researching your own store, review Shopify's authorized reports and analytics rather than substituting a competitor checker. Shopify's sales report documentation explains the sales measures available in those reports.
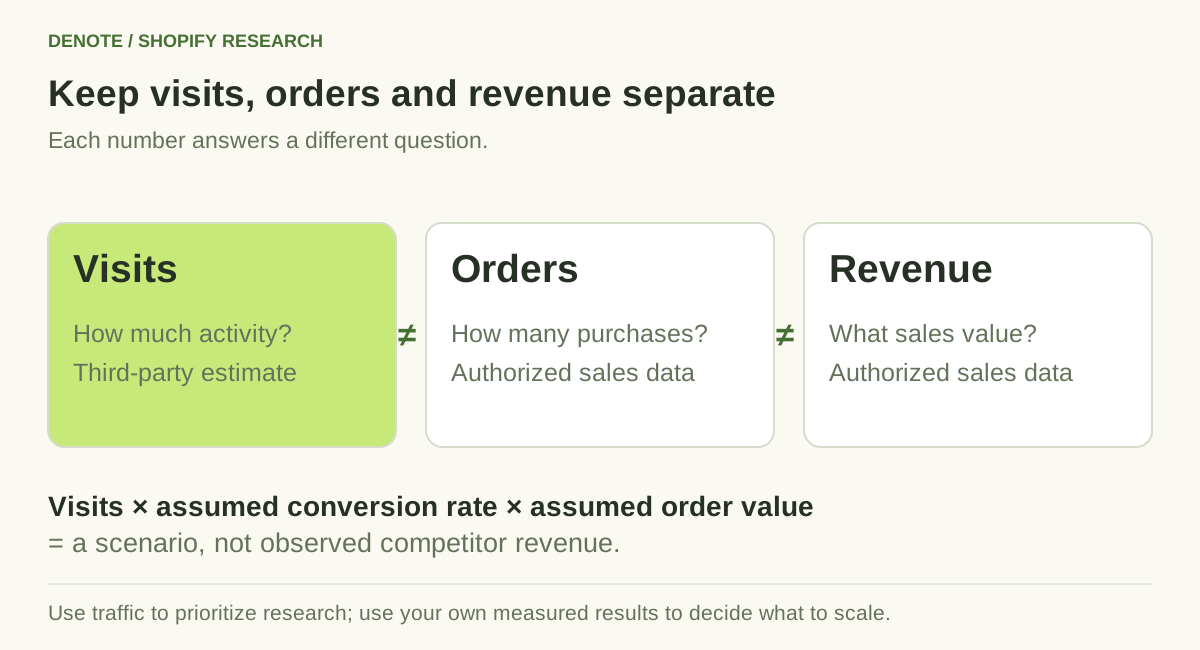
An assumed conversion rate and order value produce a revenue scenario, not an observed competitor result.
Turn a traffic check into a useful weekly note
A compact research note should contain the store, the latest available completed month, the provider's estimate, the prior comparable month, the main countries, and one observation about products or ads.
End with a decision: investigate this product, save this creative, revisit next month, or deprioritize the store. If the provider has not released a new reporting month, keep the previous figure labeled with its original month. Checking a monthly estimate every week does not make it a weekly metric.
For the storefront side of this routine, use the Shopify store change tracking workflow. To inspect the products themselves, start with Shopify's best-selling collection sort.
Frequently asked questions
Can I check a Shopify store's traffic for free?
Some tools expose limited estimates or previews. Coverage, history, and access can change. Confirm which metric and month you can see before relying on the result; a free preview may be enough for a shortlist but not a full trend analysis.
Can I see a competitor's Google Analytics?
Only if the account owner grants you access. A public storefront does not give you access to its private analytics. Third-party traffic tools estimate activity using their own methods.
Is rising traffic a sign of a successful Shopify store?
It is a reason to investigate. Traffic can rise without profitable sales, and an estimate can change without revealing the cause. Compare audience fit, offers, and advertising before forming a hypothesis.
How often should I check traffic?
Match your review to the source's reporting cycle. Monthly estimates work well for a monthly comparison. Review public products and ads more often when you are actively developing a campaign.
What should I research after traffic?
Choose one relevant product or offer and examine the ads and landing page together. Denote helps connect store research with the advertising you want to study and revisit.


