.jpg)
If you’ve ever run ads that looked successful—high clicks, strong engagement—but somehow your bank account didn’t agree, then you already understand why Break Even ROAS is such a vital metric.
It’s that fine line between spending money and actually making money. Think of it as your ad campaign’s “survival line.” Stay above it, you profit. Drop below, you bleed cash.
Let’s walk through what Break Even ROAS really means, how to calculate it (without a headache), and how you can use it to sharpen your ad strategy.
What is Break Even ROAS?
At its core, Break Even ROAS—short for Return on Ad Spend—tells you the minimum revenue you need to earn from every dollar spent on ads just to cover your costs. It doesn’t mean profit; it means not losing money.
Imagine running an online store selling $100 sneakers. Between product cost, shipping, and payment fees, each pair costs you $70. Your Break Even ROAS would be the ratio that ensures your $30 margin isn’t eaten up by ad spend.
In simple terms:
- If your ROAS equals your Break Even ROAS, you’re breaking even.
- If it’s higher—you’re making money.
- If it’s lower—time to hit pause and re-strategize.
Break Even ROAS vs. Regular ROAS vs. Target ROAS
These three cousins often get confused, but they play different roles in your marketing toolkit.
- Regular ROAS measures your actual performance: how much revenue you generated per dollar spent on ads. Example: If you spent $100 on ads and earned $400, your ROAS is 4.0.
- Break Even ROAS is your threshold: the minimum ratio where you stop losing money. It’s the baseline you compare everything else against.
- Target ROAS is what you aim for once you know your break-even point. For example, if your Break Even ROAS is 2.5 and your goal is 20% profit, your Target ROAS might be 3.0.
Think of it like this: Break Even ROAS is the lifeboat, Target ROAS is the destination, and Regular ROAS is the current position of your ship.
Why Break Even ROAS Matters for Marketers and Ecommerce Brands
Because data without direction is dangerous. Many marketers brag about high ROAS without realizing their margins quietly drown beneath the surface. Break Even ROAS puts that illusion into perspective.
Knowing your Break Even ROAS:
- Stops you from scaling unprofitable campaigns.
- Helps you set smarter bids and budgets.
- Keeps your CFO (or yourself) happy because you’re managing cash flow wisely.
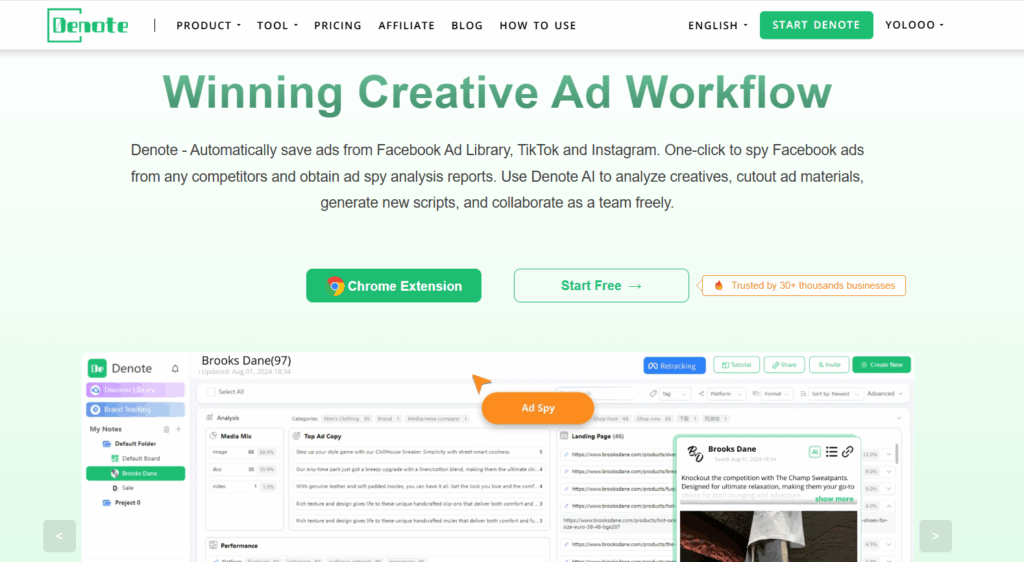
Platforms like Denote, which offer ad performance analysis and creative benchmarking, can integrate this data seamlessly into your ad workflow. By tracking Break Even ROAS across campaigns, Denote helps you identify which creatives or audiences truly drive profit—not just engagement fluff.
When you know your Break Even ROAS, you gain something rare in marketing: clarity.
When Break Even ROAS Can Be Misleading (Common Misinterpretations)
But hold up—it’s not a silver bullet. Break Even ROAS, while powerful, can mislead you if used in isolation.
For example:
- Ignoring LTV (Lifetime Value): Some businesses earn most profits later, through repeat customers. A campaign that looks unprofitable today might be a goldmine in three months.
- Not factoring in returns or refunds: Especially in fashion or dropshipping, returns can slash your real revenue.
- Assuming all channels are equal: A 3.0 ROAS on Google might be wildly different from 3.0 on TikTok because of acquisition cost or retention rates.
The key takeaway? Break Even ROAS is your foundation—but not your finish line.
The Core Formula — How to Calculate Break Even ROAS
Alright, here’s the fun part (I promise it’s not as scary as it looks). Let’s crunch the numbers and turn your ad spend into clarity.
The Standard Formula (Single Product View)
The most common way to calculate Break Even ROAS is:
Break Even ROAS = Selling Price ÷ (Selling Price − Total Costs)
Where:
- Selling Price = what your customer pays
- Total Costs = COGS + Shipping + Transaction Fees + Variable Costs
Example: If your product sells for $100 and total costs are $70: Break Even ROAS = 100 ÷ (100 − 70) = 3.33
This means you need a ROAS of 3.33 (or 333%) just to not lose money. When your actual ROAS is above 3.33, you’re profitable. If it’s below—ouch—you’re in the red.
Alternative Formula Using Break-Even CPA
Another way to look at it (especially helpful if you track conversions or CPA—Cost Per Acquisition) is:
Break Even ROAS = Selling Price ÷ Break-even CPA
Let’s say your average sale is $100, and your break-even cost per acquisition is $30. Then your Break Even ROAS = 100 ÷ 30 = 3.33 — same result, just from another angle.
This approach is great if you’re managing multiple ad platforms and want to simplify metrics across campaigns.
Platforms like Denote often allow marketers to sync cost data from different ad networks, letting you compute break-even thresholds in one dashboard instead of juggling spreadsheets.
Step-by-Step Calculation Process
Let’s get hands-on. Here’s how to compute your own Break Even ROAS in three easy steps.
Step 1 — Gather Your Key Metrics (AOV, COGS, Fees, etc.)
Start with your AOV (Average Order Value). Then, gather all costs tied directly to each sale:
- Product cost (COGS)
- Packaging and shipping
- Payment processor fees
- Marketing platform fees
- Discounts or promo codes
Keep this data recent—using last month’s numbers is better than last year’s averages.
Step 2 — Separate Variable and Fixed Costs
Variable costs go up and down with each order—think product costs or shipping. But fixed costs, like rent or salaries, stay the same no matter how many sales you make. Break Even ROAS usually just looks at variable costs.
Still, if your fixed costs are high, you can create a stricter version that factors those in too. That way, you see the real ROAS you need to cover all your expenses.
Step 3 — Plug Numbers into the Formula and Calculate
Once you’ve got the numbers, it’s plug-and-play:
- Subtract your total costs from the selling price.
- Divide the selling price by that difference.
That’s your Break Even ROAS. If your campaign ROAS equals that number—congrats, you’re floating. If it’s higher—cheers, you’re sailing smoothly. If it’s lower—time to patch the leaks before scaling further.
Practical Examples
Theory is fine, but numbers tell the truth. Let’s look at a few real-world cases to see how Break Even ROAS works in different scenarios.
Example 1 — Low-Margin Physical Product
Imagine you sell a $50 phone case. Your total cost per unit (COGS + shipping + fees) is $35.
Break Even ROAS = 50 ÷ (50 − 35) = 3.33
So you must generate at least $3.33 in revenue for every $1 spent on ads to break even. If your current campaign’s ROAS is 2.8, you’re technically losing money—though it might make sense if it’s building a high-retention audience.
Example 2 — Digital Product or Subscription
You sell an online course for $200. Your variable costs (payment fees, hosting) are just $20.
Break Even ROAS = 200 ÷ (200 − 20) = 1.11
So anything above 1.11 means profit—digital products shine here because they scale easily and have low variable costs. That’s why creators and SaaS businesses often enjoy far better ROAS flexibility than physical product brands.
Example 3 — Blended ROAS Across Multiple SKUs
If you sell multiple items with different margins, calculate a weighted average Break Even ROAS.
For instance:
- Product A: ROAS break-even = 2.5, accounts for 60% of revenue
- Product B: ROAS break-even = 3.0, accounts for 40% of revenue
Blended Break Even ROAS = (2.5×0.6) + (3.0×0.4) = 2.7
Tracking blended ROAS helps you understand overall profitability, not just product-by-product results.
This is where tools like Denote come in handy again—its dashboard can automatically compute blended metrics across your ad creatives and channels, so you can make decisions based on unified data instead of guesswork.
Tools and Calculators
You don’t need to be a spreadsheet wizard to calculate Break Even ROAS. There are plenty of tools to simplify the process.
When to Use a Break Even ROAS Calculator vs. a Manual Spreadsheet
If you just want a quick answer, grab an online calculator. It’s perfect for testing ad ideas or checking product margins on the fly.
But when you’re juggling a bunch of ad accounts or testing lots of products, spreadsheets—or better yet, automation tools—are the way to go. You get way more control. You can play with margins, add promo discounts, or factor in seasonal shipping costs. Stuff that online calculators usually ignore.
Recommended Free Tools and How to Interpret Results
Look for calculators that let you input:
- Selling price
- Product cost
- Ad spend
- Additional fees
The output should show your Break Even ROAS, profit margin, and possibly a chart of “profitability at different ROAS levels.”
When you read the results, remember:
- A Break Even ROAS of 2.0 means you need $2 in revenue for each $1 in ad spend.
- Anything above that number is profit; anything below is loss.
Here’s Part 2 — the continuation and completion of your 3000-word SEO blog on How to Calculate Break Even ROAS. This section covers the advanced analysis, optimization, mistakes to avoid, and conclusion — keeping a natural human tone, SEO-rich phrasing, and integrating Denote three times as required.
Advanced Considerations
Once you’ve mastered the basics, it’s time to make your Break Even ROAS analysis more sophisticated. Because in the real world, profitability isn’t just about ads — it’s about everything that happens before and after the sale.
Including Customer Lifetime Value (LTV) in Your Break Even ROAS
A lot of marketers make the same mistake—they figure out Break Even ROAS based only on that first sale. But if your brand gets a lot of repeat business or runs on subscriptions, you’re missing the bigger picture.
Think about it. If someone comes back to buy your skincare product every month and a half, you’re earning way more from that customer over time, not just from the first order. That means your Break Even ROAS doesn’t have to be as high. You can afford to spend more on ads upfront, because those repeat purchases keep adding to your bottom line.
So, let’s update the formula:
Adjusted Break Even ROAS = Selling Price ÷ (Selling Price − (Total Costs − LTV Add-on))
For instance:
- Selling Price: $50
- Costs: $35
- Expected LTV contribution: $15
Adjusted Break Even ROAS = 50 ÷ (50 − (35 − 15)) = 1.67
That’s a huge difference — meaning campaigns that look unprofitable today could be healthy in the long term.
Adjusting for Returns, Refunds, and Attribution Windows
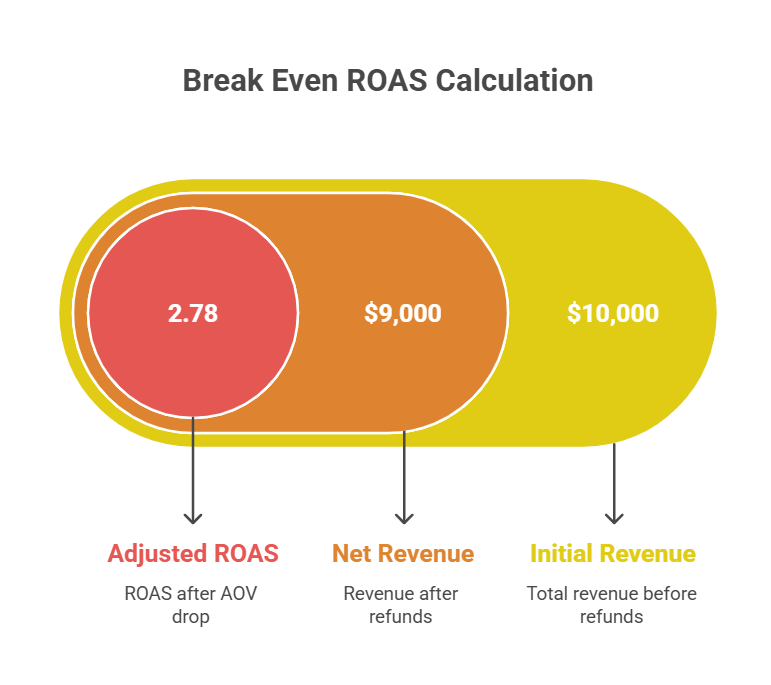
Another common oversight? Returns and refunds. If your refund rate is 10%, your real ROAS is 10% lower than what the ad platform shows.
To fix this, adjust your revenue inputs by net revenue instead of gross.
Example: If your total revenue is $10,000 but $1,000 is refunded, use $9,000 in your calculation.
Also, be aware of attribution windows — that seven-day click from Meta or one-day view from Google Ads. Your Break Even ROAS might look weak initially but could strengthen over time as more conversions roll in.
Accounting for Fixed Costs and Overhead
Fixed costs — salaries, software, rent, even your coffee budget — don’t fluctuate per sale but still eat into profit. To be ultra-accurate, you can factor in a portion of these into your Break Even ROAS.
For instance, if fixed costs are $10,000/month and you make 1,000 sales monthly, add $10 per sale into your cost structure. It makes your Break Even ROAS slightly higher but more realistic.
Sensitivity Analysis — What Happens When AOV Drops by 10%?
Let’s do a quick experiment. Suppose your current AOV is $100, and your Break Even ROAS is 2.5. If your AOV drops by just 10% to $90, your Break Even ROAS increases to 2.78.
That’s a small change with a big impact. It’s like tightening a string on a guitar — one slight adjustment, and the tune changes entirely.
That’s why smart marketers rerun Break Even ROAS scenarios whenever pricing, shipping, or promotions change.
How to Use Break Even ROAS in Campaign Optimization
Now that you can calculate it, the real magic lies in using Break Even ROAS to optimize and scale your campaigns efficiently.
Set Break Even ROAS as a Baseline for Bidding and Budgeting
Treat your Break Even ROAS like your “red line.” When setting up campaigns, make sure your bidding strategy aligns with staying above that threshold.
In Meta or Google Ads, you can set Target ROAS bidding slightly above your break-even point to maintain a profit buffer.
Example: If your Break Even ROAS is 2.5, set your Target ROAS to 3.0 for healthy profit margins.
Lower BECPA or Increase AOV to Improve Profitability
Sometimes it’s easier to reduce costs than to chase higher ROAS numbers. You can:
- Improve landing page conversion rates to lower your CPA
- Offer bundles to raise AOV
- Negotiate better product or shipping costs
Each improvement directly shifts your Break Even ROAS downward — giving you more breathing room for ad scaling.
Scaling Campaigns Above Your Break Even ROAS
Once you consistently exceed your Break Even ROAS, congratulations — you’ve unlocked the golden zone. Now you can start scaling intelligently.
Increase your ad spend gradually (10–20% per week) while monitoring performance. Watch for diminishing returns — that moment when higher spend causes efficiency to drop below break-even.
It’s a delicate dance between growth and margin — and mastering it separates thriving brands from those stuck in the “almost profitable” loop.
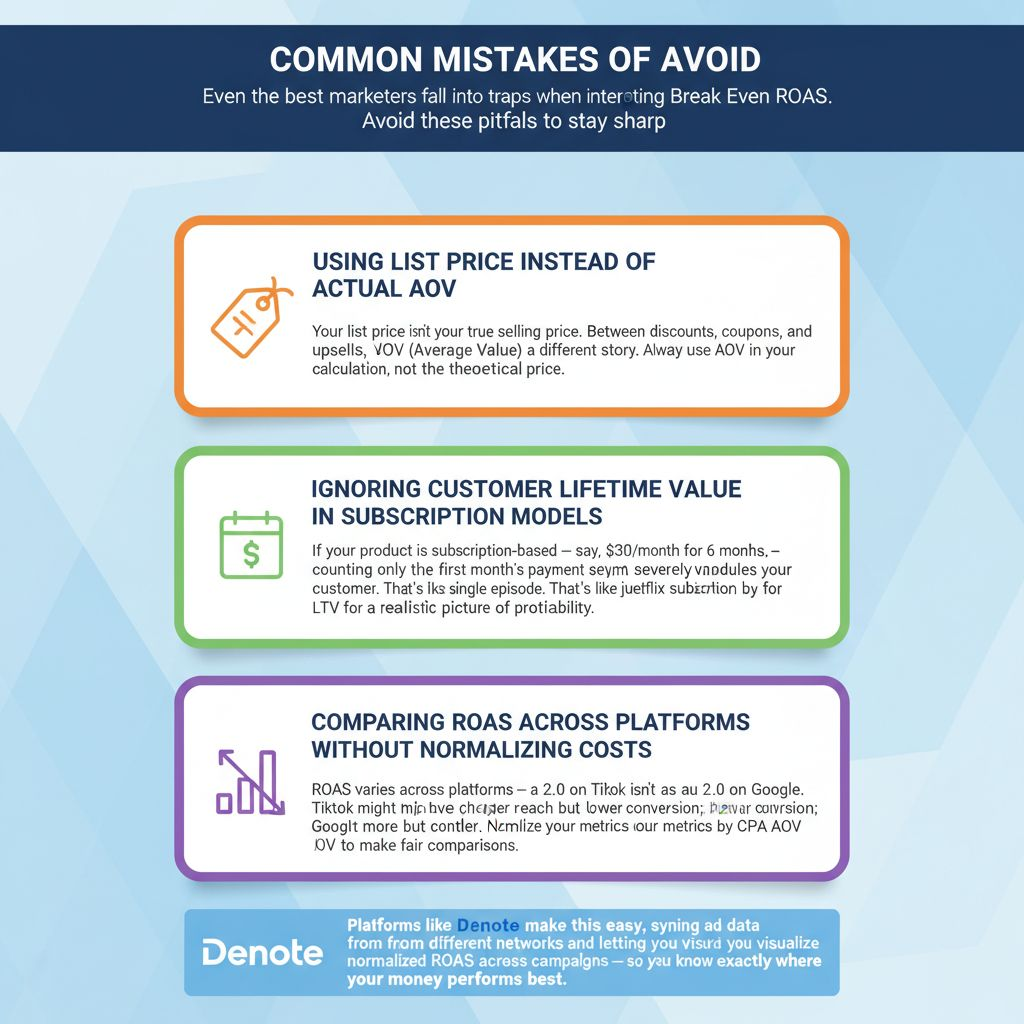
Common Mistakes to Avoid
Even the best marketers fall into traps when interpreting Break Even ROAS. Avoid these pitfalls to stay sharp.
Using List Price Instead of Actual AOV
Your list price isn’t your true selling price. Between discounts, coupons, and upsells, your AOV (Average Order Value) often tells a different story. Always use AOV in your calculation, not the theoretical price.
Ignoring Customer Lifetime Value in Subscription Models
If your product is subscription-based — say, $30/month for 6 months — counting only the first month’s payment severely undervalues your customer.
That’s like judging a Netflix subscription by a single episode. Factor in LTV for a realistic picture of profitability.
Comparing ROAS Across Platforms Without Normalizing Costs
ROAS varies across platforms — a 2.0 on TikTok isn’t the same as a 2.0 on Google. TikTok might have cheaper reach but lower conversion; Google might cost more but convert better.
Normalize your metrics by CPA and AOV to make fair comparisons. Platforms like Denote make this easy, syncing ad data from different networks and letting you visualize normalized ROAS across campaigns — so you know exactly where your money performs best.
Quick Reference & Cheatsheet
Because sometimes, you just need a one-liner to keep things simple.
One-Line Formulas and Shortcuts
- Basic Formula: Break Even ROAS = Selling Price ÷ (Selling Price − Total Costs)
- Using CPA: Break Even ROAS = Selling Price ÷ Break-even CPA
- Adjusted for LTV: Break Even ROAS = (Selling Price + LTV Add-on) ÷ (Selling Price − Total Costs)
Keep these in your notes — they’ll save you time during campaign audits or pitch meetings.
Spreadsheet Template for Instant BEROAS Calculation
A quick spreadsheet can become your best friend. Set up columns for:
- Selling Price
- COGS
- Shipping
- Fees
- Ad Spend
Then add a formula to automatically calculate Break Even ROAS. You can even color-code it:
- Green = profitable
- Yellow = near break-even
- Red = losing money
Some marketers connect Google Sheets directly to ad APIs or use Denote’s integrations to automatically populate these fields — turning your Break Even ROAS into a live dashboard that updates daily.
FAQs
Let’s tackle a few quick questions marketers often ask about Break Even ROAS.
Is a Higher ROAS Always Better?
Not necessarily. A higher ROAS usually means better efficiency, but chasing too high a ROAS can stunt growth. Sometimes, slightly lowering ROAS (and accepting thinner margins) can help scale faster if it brings in more customers with high LTV.
How Often Should I Recalculate My Break Even ROAS?
At least once per month—or whenever a major cost changes. Seasonal shipping, supplier pricing, or platform fee adjustments can shift your break-even line. Treat it like checking tire pressure before a road trip: it only takes a few minutes, but prevents expensive breakdowns later.
Can Break Even ROAS Be Negative?
In theory, no — but in practice, yes, if your product margins are negative or your costs exceed revenue. That’s a flashing red alert to revisit pricing or cost structure. A negative Break Even ROAS means you’re in an unsustainable model and need to fix fundamentals before running more ads.
Conclusion
Understanding how to calculate Break Even ROAS is more than a math exercise — it’s a mindset shift. It helps you stop guessing and start knowing exactly when your campaigns make or lose money.
In a world where ad algorithms change weekly and CPCs keep climbing, Break Even ROAS becomes your anchor — the one number that never lies.